Incorporating Capital in American Carbon, Energy, and Material Footprints
‘Capital’ assets include buildings, machinery, software, and infrastructure systems such as road networks. These assets are typically included to some extent in environmental life cycle assessments (LCA) of goods and services, but are no incorporated in most environmentally-extended input-output (EEIO) models, including the US Environmental Protection Agency’s USEEIO. Different methods exist for incorporating, or ‘endogenizing’ inputs from capital assets into the supply chains of goods and services.
In order to enable easy estimation of the capital-inclusive environmental impacts from consumption of goods and services in the US, the authors have created CIFT-US, a user-friendly spreadsheet tool.
In this project, a highly detailed capital flow matrix approach is followed to distribute the use of fixed capital assets to consuming industries for the economy of the United States. This facilitates a detailed national and sectoral examination of how much capital contributes to environmental impacts consumption, provides a more comprehensive basis for comparing environmental impacts of different goods and services, and highlights by how much footprints are underestimated when capital inputs are excluded. In 2012, capital consumption accounted for 13%, 19%, and 40% of national total carbon, energy, and material footprints respectively. Capital contributions were much larger for certain sectors, such as housing and government expenditures.
CIFT-US: Capital-Inclusive Footprint Tool for United States
In order to enable easy estimation of capital-inclusive environmental impacts of consumption of goods and services in the US, the authors have created CIFT-US, a user-friendly spreadsheet tool available for non-commercial use.
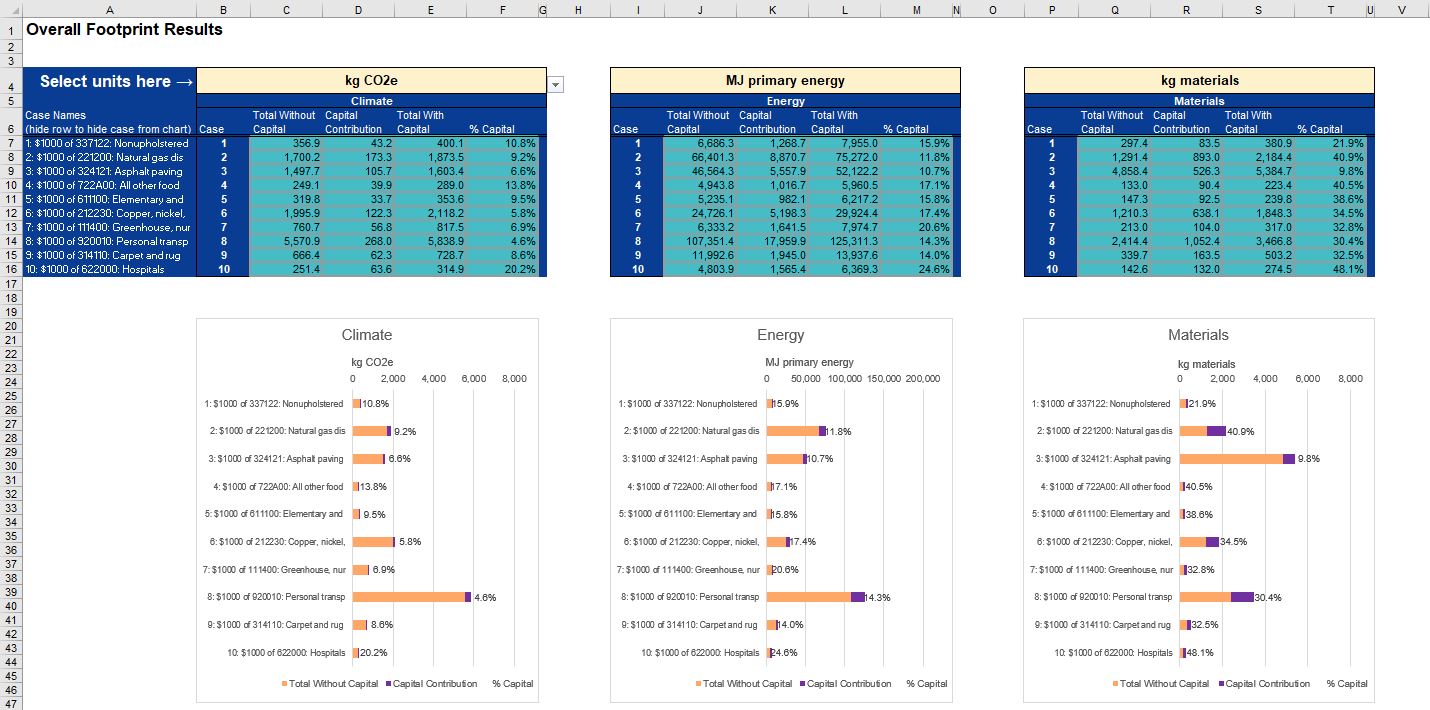
This tool allows users to quickly estimate carbon, energy, and material footprints associated with consumption of a good or service, measured in current US dollars for the years 2005-2019. It can support wide ranging research applications, such as calculating and comparing environmental impacts of alternative products, estimating the contribution of capital to environmental footprints of products, or calculating product-wise footprints of total consumption for selected years (2007, 2012). The developers envisage it to be of great use for students and researchers undertaking research projects, organizations who wish to identify product groups with high environmental impacts, and reduce environmental footprints of their purchases.
We invite interested users to download the original version of the tool, whichis is freely available for non-commercial use in the Supporting Information S3 of Berrill et al. (2019). Original and subsequent versions of CIFT-US are become available at this GitHub link. Please see the ‘MetaData’ tab for details on referencing the tool. Click here to download the original version of CIFT-US directly.
Click here to watch a short video providing an overview of CIFT-US!
__________________________________________
Capital in the American Carbon, Energy, and Material Footprint
Peter Berrill1*, T. Reed Miller1,2, Yasushi Kondo3, Edgar G. Hertwich1,2
1 Center for Industrial Ecology, School of Forestry and Environmental Studies, Yale University, New Haven, USA
2 Department of Chemical and Environmental Engineering, Yale University, New Haven, USA
3 Faculty of Political Science and Economics, Waseda University, Tokyo, Japan
* Corresponding author: peter.berrill@yale.edu
Abstract
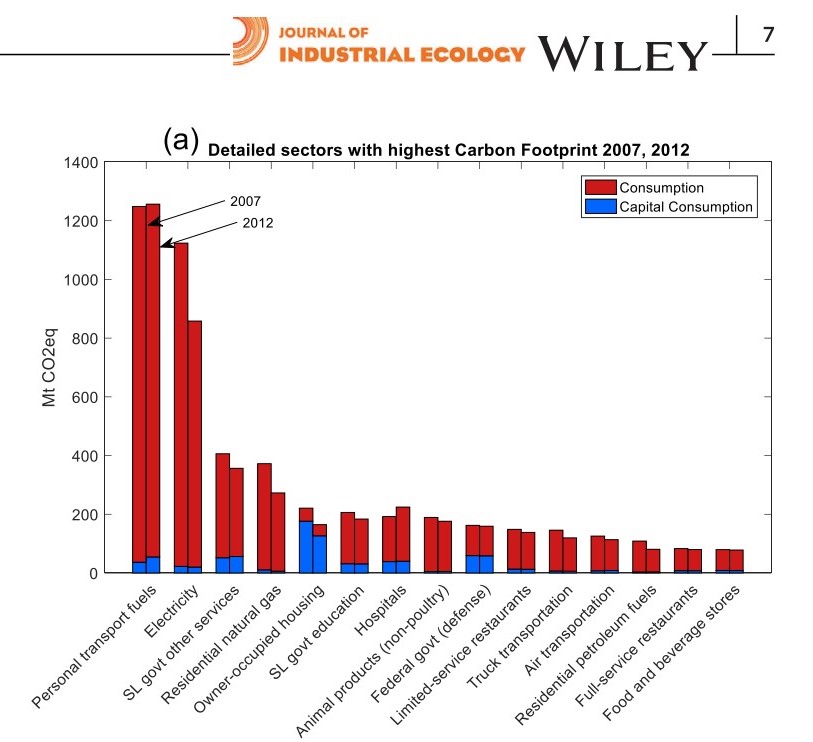
Stocks of fixed capital play a vital role in fulfilling basic human needs and facilitating industrial production. Their build-up requires great quantities of energy and materials, and generates GHG emissions and other pollution. Capital stocks influence economic production and environmental pollution through their construction and over subsequent decades through their use. We perform an environmental footprint analysis of total consumption, capital investment and capital consumption in the US for 2007 and 2012. In 2012, capital consumption accounted for 13%, 19%, and 40% of total carbon, energy, and material footprints respectively. Housing, federal defense, state and local government education and other services (including household consumption of roads), personal transport fuels and hospitals are the consumption sectors with largest capital footprints. These sectors provide fundamental needs of shelter, transport, education and health, underlying the importance of capital services. Endogenizing capital causes the biggest proportional increase to footprints of sectors with low environmental multipliers. This work builds upon existing input-output models of production and consumption in the US, and provides a capital-inclusive database of carbon, energy and material footprints and multipliers for 2007 and 2012.
___________________________________________________________________________
Method for Endogenizing Capital in the USEEIO
T. Reed Miller1*, Peter Berrill2, Paul Wolfram2, Ranran Wang2, Yookyung Kim2, Xinzhu Zheng2, Edgar G. Hertwich1,2
1 Department of Chemical and Environmental Engineering, Yale University, New Haven, USA
2 Center for Industrial Ecology, School of Forestry and Environmental Studies, Yale University, New Haven, USA
* Corresponding author: reed.miller@yale.edu
Summary
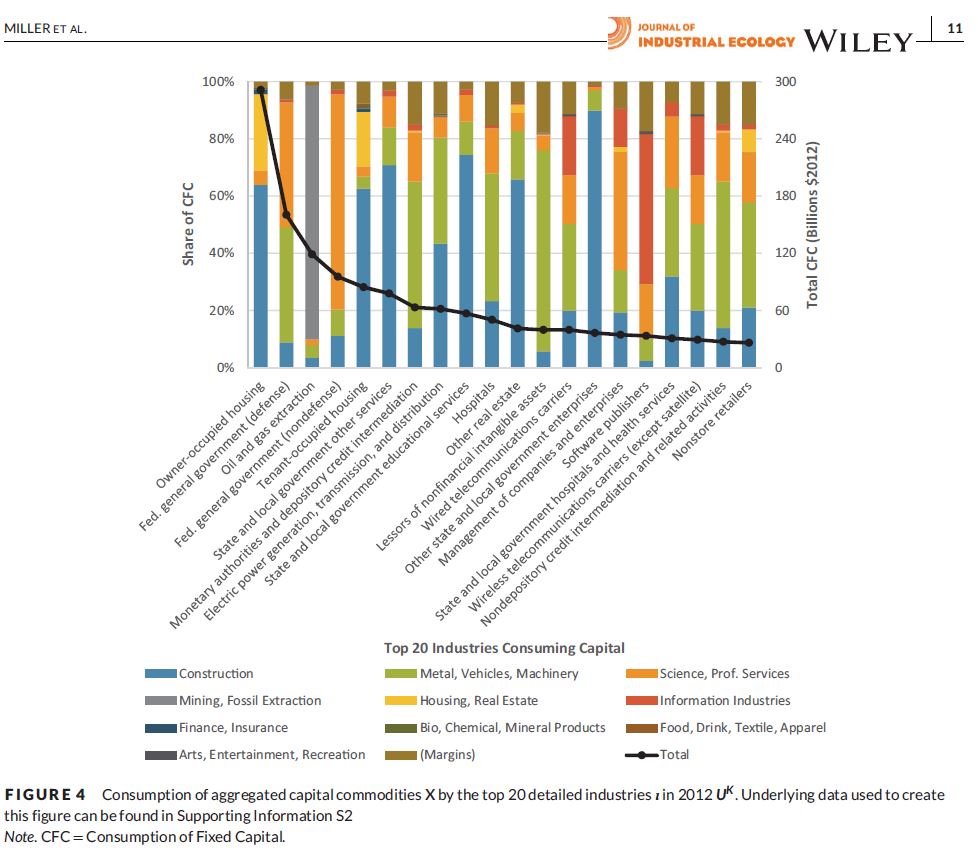
Each year, businesses, governments, and homeowners in the United States (US) invest around one-fifth of gross domestic product into the creation of capital assets such as buildings, machinery, and software to enable production and consumption. Use of capital is typically included to some extent in environmental life cycle assessments of goods and services but is not incorporated into most environmentally-extended input-output (EEIO) models, including the US Environmental Protection Agency’s USEEIO. Capital assets are typically created in years prior to their use, so a challenge lies in distributing the impacts of their creation over time. In this work, a highly detailed capital flow matrix approach is followed to distribute the use of fixed capital assets to consuming industries. Data from the US Bureau of Economic Analysis’s Fixed Asset Accounts is merged with its Industry Accounts data by the creation of concordance tables. Public highways and streets are partially reallocated to industries operating vehicles. The resulting capital use matrix is later combined into a modified USEEIO. “Housing” is found to be the largest consumer of fixed assets, followed by general government, fossil fuel extraction, and financial industries involved in leasing. Construction, vehicles, and machinery are mostly used by industries in the form of capital assets. The share of intellectual property products (IPP), equipment, and structures fixed assets used is consistent with expectations: industries like housing are dominated by structures, transport, and healthcare by equipment, and management by IPP.