Since the 1950s, the unprecedented growth in Kailua-Kona compared to the relatively stable growth in Hilo indicate that these areas have significantly different landscapes shaped by factors such as climatic differences, demographic composition, economic organization, and planning regulations.
To gain a better understanding of the impacts of land-use decisions, we are investigating the dynamics of land-use and land-cover change by coupling remote satellite imagery, statistical demographic data, and biophysical data for Hilo and Kailua-Kona.


1989, 2001, 2010 maximum likelihood supervised classification images showing the footprint of Hilo remaining stable. Note, the increased amount of blue in the center portion of the images on the right indicates the conversion of agricultural and forested lands to built environment.
Approximately 4,000 registered maps dating back to the early 1800s have been collected for the study to inform our understanding of historical land use on the island. Additionally, Land Commission Awards (LCA) and associated documentation are being reviewed to find details not only of the size of the land but also the various uses of the land, such as the presence of houses, the types of geographic features on a property, and the types of agriculture being practiced. LCAs were first issued in 1848, when King Kamehameha III, Kauikeaouli, undertook the Great Māhele, or land privatization.
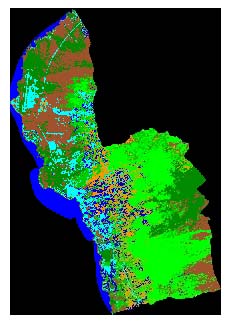
Kona Classification for 2010. Cyan = Urban; Brown = Lava (bare rock); Dark Green = Vegetated Lava Flow; Light Green = Forested Area; Orange = Agriculture; Blue = Water; Blue 1= Mixed Vegetation Near Urban Areas
The remote sensing goal of this project is to characterize the spatial and temporal changes in urban areas and land-use in Hilo and Kona over the last forty years, and thereby, to help answer the following questions: Have these cities developed along agricultural fringes? What types of land have been converted to urban uses? Agricultural land loss due to urban encroachment is prevalent in large cities, but do the same patterns emerge with smaller cities? This study is using Landsat images over a period of 21 years, as shown above, to investigate these questions. To corroborate the interpretation of the Landsat images, random points within the study boundaries were verified on the ground (“groundtruthing”).
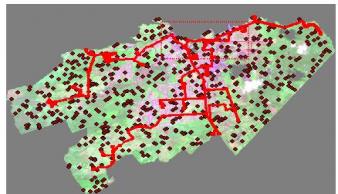
Hilo groundtruthing points and route for groundtruthing, June 2010 (ArcMap Image)
This project is supported by a grant from the National Science Foundation.